Why do people invest in mutual funds? It is either for wealth accumulation through diversification or for the ability of the fund manager to manage the portfolio for them or both.
There are around 2500 mutual fund schemes in India. How to choose the one that best suits your interest? Sole reliance on past performance might not be the best way to go. A befitting mutual fund scheme/portfolio for an investor would depend majorly on the one that suits his/her objective and risk appetite.
FACTORS TO CONSIDER BEFORE CHOOSING A MUTUAL FUND CATEGORY
(1)Investment Objective
(2)Time Horizon
(3)Risk appetite
So here is an illustration of choosing a mutual fund category based on the above factors for an investor

FACTORS TO CONSIDER BEFORE CHOOSING A MUTUAL FUND SCHEME
Once you have zeroed in on the category of mutual funds, the next step is to choose a mutual fund scheme under the selected category.
(1)TRACK RECORD OF AMC AND FUND MANAGER
A fund manager’s expertise and track record should be a major factor that drives your decision-making towards investing in a fund as you are solely depending on his experience to manage a portfolio for you.
The quality of the business and management also defines the returns that you will get in the long run.
(2)FUND PORTFOLIO
(2.a)PORTFOLIO TURNOVER RATIO
The portfolio turnover ratio shows the frequency of stock purchases and sales facilitated by fund managers in a mutual fund portfolio. Changes in the portfolio are to be expected from time to time. But how frequently they occur matters as it could be a good way to assess the fund manager’s conviction behind each change in the portfolio and that it is not just a trial and error process.
(2.b)PORTFOLIO CONCENTRATION RATIO
Portfolio concentration occurs in mutual funds when the majority of the portfolio is concentrated in one sector or company. It is necessary to look at the portfolio concentration ratio to gauge whether the fund’s outperformance is because of the fund manager’s strategic allocation or because of its major exposure to a well-performing sector or stock.
(3)PERFORMANCE AND RISK METRICS
(3.a) STANDARD DEVIATION
Standard deviation measures how much the return has strayed from the average returns that are based on the fund’s historical performance. The risk inherent in an investment in terms of volatility is determined using Standard deviation.
A fund with a record of consistent returns might display a lower standard deviation. However, a fund with higher volatility is likely to have a higher standard deviation.
(3.b)SHARPE RATIO
Sharpe Ratio measures the risk-adjusted returns potential of a mutual fund. It shows the degree of returns generated by an investment after taking risk into account.
Let’s assume there are two equity funds - Fund X gives 16% returns and Fund Y gives 18% returns. When asked to choose between the two, one would choose Fund Y. Additionally, Fund X has a standard deviation of 18% and Fund Y seems to have a standard deviation of 35%. This shows Fund Y has been generating higher returns by taking in substantial risk. If this risk/volatility is worth the 2% extra return is up to the investor.
Thus, the Sharpe ratio of a mutual fund evaluates the extra return on each additional unit of risk that is incurred giving a bigger picture of the risk-return trade-off.
(3.c) DRAWDOWNS
The investment drawdown measures the lowest point of an investment after its most recent high.
For example, let’s say the performance of a mutual fund looks good overall and the fund has not experienced any excessive drawdowns in value. Over 6 years, the fund has only experienced two significant drawdowns – one around 10% and the other being around 20%. However, when drawdowns have occurred they have lasted for a significant period of 16 months (i-e) when a significant decline in the mutual fund’s NAV has occurred, it has approximately taken 1.4 years to recover the loss and rise to a new high.
In this case, the maximum drawdown would be 20% and the drawdown duration would be 16 months. Thus, drawdowns calculate the maximum loss percentage and drawdown duration calculates the time taken to recoup its losses after its fall from a previous high which is crucial in understanding the performance of the fund during market turbulence where the fund’s drawdown could be compared with the benchmark or index’s drawdown.
(3.d)RETURN CONSISTENCY
A simple way to measure how consistent a mutual fund has been performing over a select period is to use rolling returns.
For each of these metrics, the fund’s value can be compared with the benchmark or peers to evaluate their relative past performance and risk.
NOTE – Past performance is not indicative of future returns
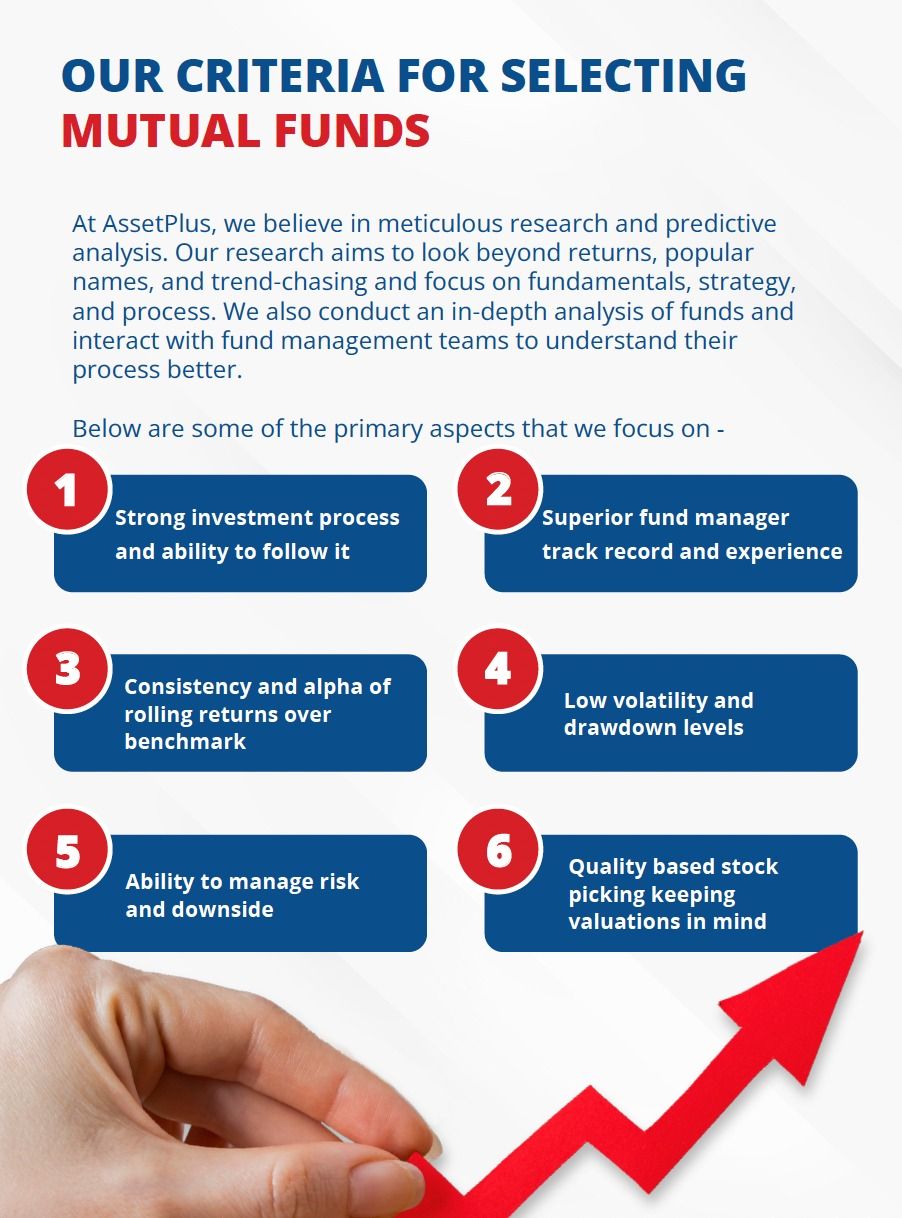
THE ASSETPLUS ADVANTAGE
TO CONCLUDE...
Your responsibility as an investor doesn’t end once you have decided on the right set of funds and remain invested in the scheme throughout the desired tenure. It is important to review and rebalance the allocation of your investments or the asset classes from time to time. A timely review of your investments would be the key to stable returns and working towards your intended financial goals during various market phases.
Get in touch with your investment manager to benefit from active management of your portfolio.